Research Article | | Peer-Reviewed

A Universal Model for General Gross Domestic Product Across Global Economies

Received: 3 April 2024     Accepted: 9 May 2024     Published: 17 May 2024
Views:       Downloads:
Abstract

In addressing the need for a robust economic measure, this paper presents a mathematical model to forecast Gross Domestic Product (GDP) across diverse global economies. Our model, constructed from a dataset spanning 39 years from 16 varied economies, deciphers GDP by dissecting its fundamental components of population and productivity. Through meticulous literature review and data analysis, the research develops four predictive models, using linear and exponential trends, to represent the immediate and projected rates of change in both population and productivity. The research reveals a nuanced dynamic between these elements, identifying productivity, especially in infrastructure, healthcare, telecommunications, and innovation, as a pivotal force in driving economic growth. The study not only underlines the significant influence of these sectors but also the critical role of developed economies in aiding less developed ones to counteract the widening poverty gap. A comprehensive sensitivity analysis within the paper evaluates the impact of these factors on GDP, equipping policymakers with essential insights into enhancing economic progress. By combining immediate and long-term growth metrics derived from twenty-four influential variables into a cohesive predictive model, this research illuminates the complex interplay of forces shaping GDP trajectories. It suggests that while boosting population can yield short-term economic gains, enduring prosperity hinges on amplifying productivity. Moreover, the study points to the potential socio-economic divides that necessitate proactive measures for equitable development. Although challenges such as data dependency and growth discrepancies are acknowledged, the model proposes more frequent data analyses for capturing economic fluctuations accurately. Conclusively, the paper bridges a critical gap in economic modeling literature and provides a pragmatic framework for crafting inclusive economic policies and development strategies, thus making a significant contribution to both theoretical and applied economic fields.

Published in International Journal of Economics, Finance and Management Sciences (Volume 12, Issue 3)
DOI 10.11648/j.ijefm.20241203.11
Page(s) 127-141
Creative Commons

This is an Open Access article, distributed under the terms of the Creative Commons Attribution 4.0 International License (http://creativecommons.org/licenses/by/4.0/), which permits unrestricted use, distribution and reproduction in any medium or format, provided the original work is properly cited.

Copyright

Copyright © The Author(s), 2024. Published by Science Publishing Group

Keywords

Economic Growth, Gross Domestic Product, Mathematical Modeling, Prediction, Global Economy, Economics, Forecasting, Economic Policy

1. Introduction
Gross Domestic Product (GDP) encapsulates the total monetary value of all finished goods and services produced within a country's borders during a specified period . This aggregate includes not only market-based goods and services but also significant nonmarket production such as government services in defense and education . GDP is pivotal, providing a snapshot of an economy's size and its overall performance, and it plays a crucial role in guiding both policymakers and central banks in their decision-making processes . However, given its intricate nature, GDP figures are often subject to revisions to ensure their accuracy and reliability as economic indicators .
Regarded as a prime indicator for international economic comparisons, GDP is also a reflection of a country's economic progress and is often considered the "world's most powerful statistical indicator of national development and progress" . It is determined through three approaches: production, income, and expenditure, each theoretically yielding the same national output and income figures .
An economy with a rising GDP is typically characterized by an improving quality of life and a higher standard of living, affording its population greater financial security and the means to fulfill more of their desires and needs. Beyond the present metrics, the sustainability and growth of GDP are essential for maintaining a high standard of living in the future. Therefore, the aspiration for increased GDP and GDP growth is a common goal among economies worldwide.
With the aim of advancing the well-being of global populations, this paper seeks to:
1. Uncover the diverse factors that impact GDP and its growth trajectories.
2. Formulate a comprehensive mathematical model to gauge an economy's instantaneous GDP, applicable on a global scale.
3. Project future GDP trends and growth rates for economies around the world.
4. Evaluate and recommend strategies to enhance GDP growth, thereby aiding economies in their pursuit of greater economic success.
By examining these elements, this paper intends to provide actionable insights that can contribute to the betterment of living standards and quality of life on a global scale.
2. Literature Review
Our examination of eleven scholarly works reveals several recurring themes and challenges in GDP prediction methodologies:
1. A prevalent limitation is the specificity of GDP models to individual economies, constraining their applicability on a global scale. Such region-centric models may skew towards local economic characteristics, thus failing to represent other economies' economic production adequately. The implications of this limitation are demonstrated by studies focusing on distinct regions, including Sweden , Pakistan , and China .
2. Data scarcity is another significant issue. Many models rely on a singular economic factor, which is prone to inaccuracies given GDP's reliance on a complex interplay of variables. Furthermore, a dearth of long-term data exacerbates this problem, leading to imprecise GDP modeling. This is evident in studies using nighttime satellite imagery for sub-national GDP estimation and those exploring health's impact on economic growth .
3. The complexity of GDP’s determinants renders its prediction challenging, with many models failing to maintain accuracy in the long term. The compounding errors over extended periods can result in considerable discrepancies, as noted in econometric studies of GDP time series and forecasts in manufacturing industries .
4. Although computer algorithms and machine learning models offer improved accuracy through sophisticated computational techniques, they come with the caveat of extensive training time. Such methods, while potentially more precise, may not be feasible for swift application across multiple economies, as highlighted in research on Kenyan GDP using ARIMA models and MATLAB simulations for China .
5. Many studies have established correlations between certain factors and GDP but fall short of quantifying the exact impact on GDP values. The lack of precise quantification means the relative importance of factors influencing GDP remains indeterminate, as seen in analyses of GDP volatility in Japan and cross-country medical expenditure studies .
6. Lastly, the reviewed literature commonly omits an evaluation of the predictive models, forgoing an opportunity to derive actionable insights. This absence is universally observed across the examined studies.
However, the validity of GDP as an economic indicator is questioned by Feige , who highlights the exclusion of underground economic activities from GDP calculations, suggesting that GDP may not fully encapsulate an economy's health.
Despite these critiques, the utility of GDP as a benchmark for economic health remains. Improving GDP is synonymous with elevating living standards and meeting the populace's increasing wants and needs. Our research aims to transcend these common modeling limitations by crafting a mathematical model with global applicability. This model will incorporate multidimensional variables to predict precise GDP values for economies worldwide. Additionally, we propose to outline actionable recommendations based on our model's analysis to augment GDP.
Our proposed synthesis of a universally applicable predictive model and its accompanying recommendations represents an innovative approach in GDP modeling. The subsequent sections will elaborate on this novel methodology, which, to our knowledge, is unprecedented in the literature.
3. Methodology

3.1. Overall GDP

The Gross Domestic Product (GDP) is the quantifiable economic output of an economy and is inherently the product of two primary components: population and productivity (GDP per capita). Our approach is formalized by the equation:
GDP = Population × Productivity(1)
Here, GDP stands as the economic output measure, which the modeling process breaks down into the number of people in the economy (population) and the average economic output per person (productivity).
In preparation for our modeling, comprehensive datasets from 16 diverse economies starting from the year 1980 were compiled to identify overarching trends and inform the model's framework. To encompass global representation, the selection of countries includes varied geographic regions—from Europe to Asia, the Americas to the Middle East—and spans different stages of development as classified by the Human Development Index (HDI). These stages are further categorized into four distinct levels—high, medium, and low, including outliers—to avoid model biases.
All data sources during the model's development phase are derived from authoritative bodies such as the International Monetary Fund (IMF), the Maddison Project Database, and the World Bank, ensuring the precision and credibility of our findings.
The countries in focus include the United States of America, China, Brazil, India, Hong Kong, Haiti, Greece, Israel, Malawi, the United Kingdom, Kenya, Saudi Arabia, Japan, Finland, Australia, and Dominica. This extensive coverage, combined with a historical span of 39 years, aims to produce a model versatile enough for effective future forecasting across varying global economies.
For comprehensive data and country information, refer to Appendix 1: Information on Economies, and Appendix 2: Data of GDP, Population, and Productivity .
The collated data facilitates the initial identification of patterns that are vital to shaping the structure of the GDP, Population, and Productivity models.
For a detailed trend analysis, see Appendix 3: Trends of GDP, Population, and Productivity .
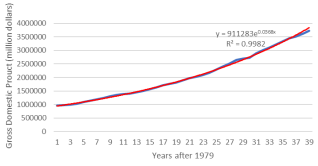
Figure 1. Trend of Weighted Average GDP.
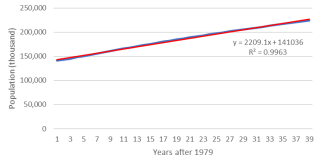
Figure 2. Trend of Average Population.
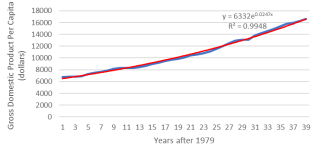
Figure 3. Trend of Weighted Average GDP Per Capita.
Observing Figures 1 through 3, the GDP displays a more pronounced correlation with an exponential trend line, as evidenced by a higher r2 value compared to the linear correlation. This aligns with the assumption that GDP's exponential increase results from the combined linear growth of population and the exponential increase in GDP per capita (GDPPC). Therefore, we infer a linear model is apt for population growth, whereas productivity follows an exponential trajectory over time.

3.2. Population

Population dynamics serve as a fundamental determinant of GDP. A larger population typically equates to greater economic output, thus amplifying GDP value. As established by our analysis, the population growth model follows a linear trend, expressed as:
Population = A + Bx(2)
Here, A represents the initial population size, B denotes the consistent annual increase, and x is the number of years elapsed.
The literature identifies four principal components influencing population changes: natality (N), immigration (I), mortality (M), and emigration (E) . These are captured in the equation:
Population = N + I – M – E(3)
Further factors impacting population include land capacity, with larger land masses generally supporting greater populations, and food supply, where increased nutrient availability positively correlates with population size . Additionally, lower living costs can lead to higher birth rates due to more affordable child-rearing , while improved healthcare infrastructure, manifested in higher life expectancy, contributes to population growth . Migration, fueled by the pursuit of better socioeconomic conditions and opportunities , also plays a significant role.
To simplify the model, we assume a uniform contribution to GDP across the population, ignoring the proportion of the population engaged in production. Gender distribution and variances in marriage rates are also considered negligible in this model.
The factors taken into account in our model are summarized as follows:
Table of Population Factors.

Factor

Measurement

Data Source

Variable

Living Cost

OECD Price Level Indices & Consumer Price Index

7, 28]

C

Capacity

Land Area

L

Food

Land Under Cereal Production & Cereal Yield

F

Survival

Infant Mortality Rate (Per 1000 live births)

I

Healthcare

Life Expectancy

H

Socio-economic environment

Unemployment Rate

34, 35]

U

Development Opportunities

Education Index

6, 37]

E

Each factor's data is normalized on a 0 to 1 scale, as per the formula:
Normalized value = Required value-Minimum valueMaximum value-Mimumum value(4)
Negative correlations are inverted so that a higher normalized value always indicates a positive relation to population size.
We have constructed two sub-models to estimate the terms A and B respectively, where A correlates with immediate population size, and B with the average change in population. They are modeled as:
A= [log2L6×F23+500]×F×U5×7640(5)
B=4dE+2dU+14dI+11dH+2dF+4dL+2dC4E+U+3I+3H+2F+5L+2C×A×0.93(6)
Subsequent figures demonstrate the efficacy of this model by comparing predicted and actual population trends. Despite some discrepancies, the model generally aligns well with the observed data. This is evident across various economies irrespective of size or geographic location, as shown in Figures 6 to 7, and detailed in Appendix 7: Modeled Population Trend of Economies.
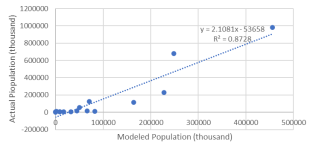
Figure 4. Correlation of Modeled Population against Actual Population.
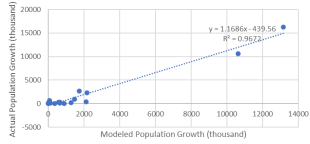
Figure 5. Correlation of Modeled Population Growth against Actual Population Growth.
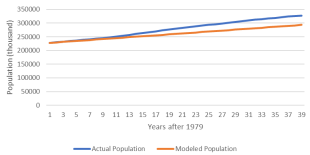
Figure 6. Trend of Actual and Modeled Population of the USA.
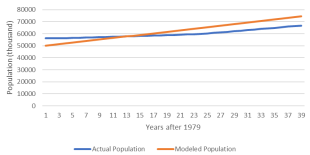
Figure 7. Trend of Actual and Modeled Population of the United Kingdom.

3.3. Productivity

In analyzing Gross Domestic Product (GDP), individual productivity, as measured by GDP per capita (GDPPC), emerges as an equally significant factor alongside population. The model proposed here captures productivity through an exponential relationship, indicating that even modest changes in productivity can have pronounced effects over time. This relationship is modeled as:
Productivity=C×Dx(7)
Where C is the initial level of productivity, D is the rate of productivity growth, and x denotes years elapsed since the baseline measurement.
The model incorporates various factors identified from the literature as influential to productivity:
1. Human Capital: Enhanced education and healthcare provision are fundamental drivers of labor productivity . The capacity for a population to be productive hinges on these elements, ensuring the workforce is skilled and healthy.
2. Physical Capital and Technology: The presence and development of infrastructure and telecommunications act as a multiplier for productivity by enabling efficient trade and information exchange .
3. Business Environment: A vibrant environment that fosters business opportunities and lowers unemployment can stimulate innovation and competitiveness, essential for productivity advancements .
4. Governance and Policy: Effective regulatory frameworks can enhance productivity by streamlining processes; conversely, cumbersome governance can stifle innovation and efficiency .
5. Population Dynamics: Generally, larger populations correlate with lower average productivity, likely due to the diffusion of resources and services .
To simplify the model, several assumptions are made: human capital and resources are uniformly distributed across the nation, and perceptions of governance, such as corruption, are consistent across different economies.
The productivity factors are quantified through the following data measurements, each normalized to a 0 to 1 scale using Equation 4:
Table of Productivity Factors.

Factor

Measurement

Data Source

Variable

Survival

Infant Mortality Rate (Per 1000 live births)

S

Healthcare

Life Expectancy

L

Socio-economic environment

Unemployment Rate

, 35]

U

Education

Education Index

, 37]

E

Governing

Corruption Perceptions Index

C

Infrastructure

Air Transport Passenger Carried

T

Innovation

Patent Application of Residents & Patent Application of Nonresidents

, 50]

P

Telecommunications

Mobile Cellular Subscriptions (Per 100 People)

M

Trades

Merchandise Imports

I

Population

Model Predicted Value

A

For an extensive dataset, refer to Appendix 8: Productivity data of Economies.
The 'C' term captures instantaneous productivity, heavily influenced by human capital. The equation reflects the compounding influence of survivability, governance, and trade:
C=lnS6×C2×I+9×E×L+3.5×3600(8)
The 'D' term, addressing productivity growth, considers the interplay of changes in both human and physical capital:
D=lndA4+dM2+dP+dT4+dC4×dP%8×dI%3×dT%×dS%11×dL%50+4.48×0.6857× dC%dA%(9)
Subsequently, by integrating the 'C' and 'D' terms, we obtain the general equation for modeling productivity over time:
Validation of this model is provided by its strong correlation with actual productivity data, which is detailed in Appendix 9 for the 'C' term and Appendix 10 for the 'D' term. The graphs illustrating these trends and comparisons are an essential component of our analysis, revealing the precision of the model against historical productivity trajectories.
In summary, this refined productivity model, embracing both immediate and growth factors, offers an expansive view of an economy's productivity evolution. Its application across different economies demonstrates its versatility and reliability in forecasting future productivity levels, detailed in Appendix 11: Modeled Productivity Trend of Economies.
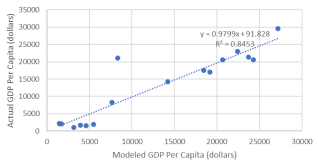
Figure 8. Correlation of Modeled Productivity against Actual Productivity.
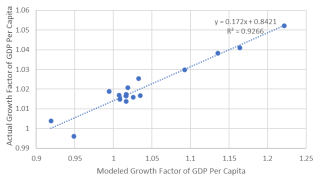
Figure 9. Correlation of Modeled Productivity Growth against Actual Productivity Growth.
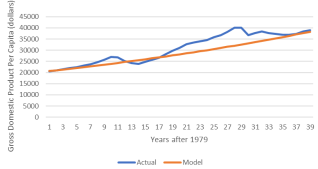
Figure 10. Trend of Gross Domestic Product Per Capita of Finland.
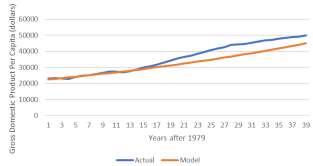
Figure 11. Trend of Gross Domestic Product Per Capita Australia.
4. Results
The culmination of our model yields a predictive value for GDP, calculated by multiplying the population and productivity per our established equation (1).
Following this model, the GDP trend is visualized alongside actual data, revealing insightful comparisons:
1. The United Kingdom and the United States display an initial accurate prediction, but long-term growth rates are over-projected.
2. Israel's initial GDP is over-estimated; however, it shows convergence with the modeled GDP over time.
3. Discrepancies are noted in China and India, where trade-related productivity growth rates significantly overstate long-term economic performance.
4. Underestimations occur in unique economies like Hong Kong and Saudi Arabia, attributable to distinctive natural resources and geographical advantages.
5. Most other economies exhibit a trend of overestimated GDP, especially those with well-developed infrastructure and lower population densities.
6. The GDP trends for Haiti and Malawi illustrate a decline, corroborated by their low Human Development Index rankings, thus affirming the model's relative accuracy.
7. These observations highlight the flexibility of the model across diverse geographic and socio-economic contexts.
For a comprehensive comparison of modeled versus actual GDP, see Appendix 12: Comparison of Modeled and Actual Gross Domestic Product.
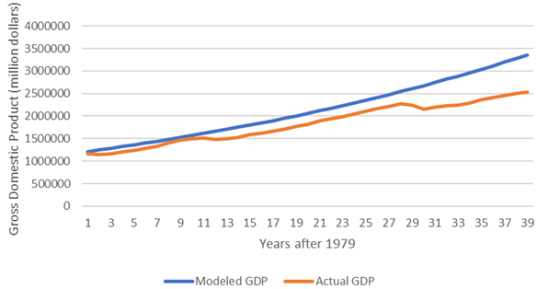
Figure 12. Gross Domestic Product Trend of the United Kingdom.
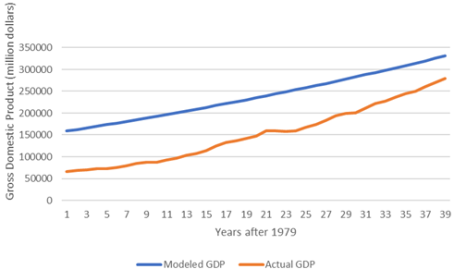
Figure 13. Gross Domestic Product Trend of Israel.
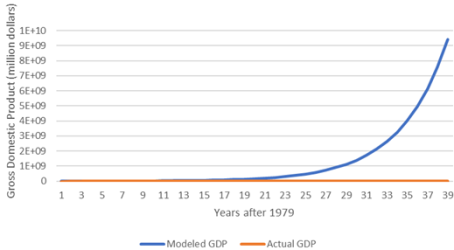
Figure 14. Gross Domestic Product Trend of China.
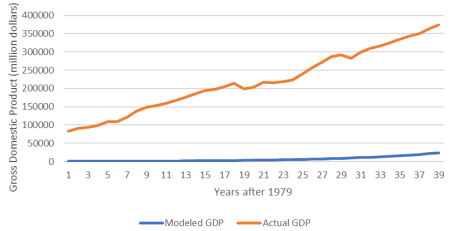
Figure 15. Gross Domestic Product Trend of Hong Kong.
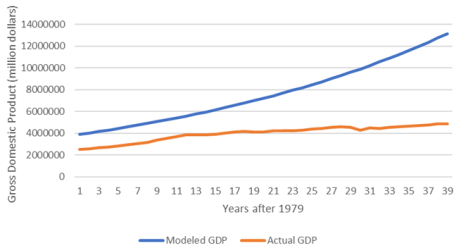
Figure 16. Gross Domestic Product Trend of Japan.
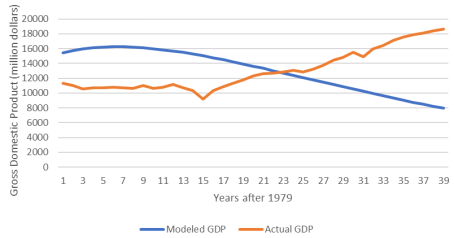
Figure 17. Gross Domestic Product Trend of Haiti.
5. Discussion

5.1. Model Sensitivity Analysis

To enhance our understanding of the GDP model's dynamics and provide actionable insights, a sensitivity analysis was conducted. This analysis probed the model’s responsiveness to variations in the 24 inputs, consisting of 12 factor variables and 12 development variables.
In the first part of the analysis, factor variables were adjusted within a standardized economic framework, where all development variables were held constant at 0.5. Each factor variable was alternately set at 0.02, with all other factors set at 0.005. The results, depicted in Figure 18 and detailed in Table 3, reveal the differential impact of each factor on GDP over a 50-year period.
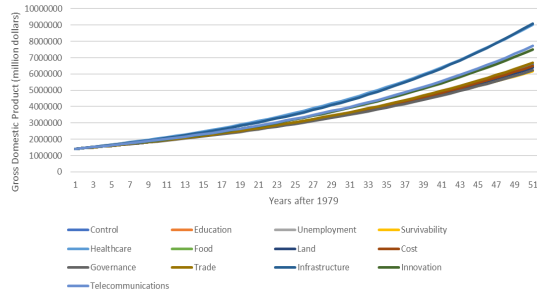
Figure 18. Modeled Gross Domestic Product of Economy Varying Factor.
Table of Varying Factors.

Factor Changed

Population Growth

Factor of Productivity Growth

Year 1 GDP

Year 50 GDP

Control

732

1.024

1464444

6591795

Education

957

1.021

1464907

6393093

Unemployment

844

1.022

1464676

6498201

Survivability

1520

1.016

1468111

6165474

Healthcare

1351

1.025

1477977

9036258

Food

844

1.022

1464676

6498201

Land

957

1.021

1464907

6393093

Cost of Living

844

1.022

1464676

6498201

Governance

732

1.022

1462775

6226486

Trade

732

1.024

1464898

6694671

Infrastructure

732

1.030

1473935

9105107

Innovations

732

1.026

1468296

7517107

Telecommunications

732

1.027

1469059

7714678

Key observations include:
1. Productivity growth is pivotal, with Healthcare, Trade, Infrastructure, Innovations, and Telecommunications demonstrating the most substantial influence on GDP by year 50.
2. Population growth displays an inverse correlation with long-term GDP; notably, Education and Survivability enhance population figures but depress productivity growth.
3. The most substantial contributors to GDP increases are identified as Infrastructure, Healthcare, Telecommunications, and Innovations.
4. The immediate (year 1) versus long-term (year 50) effects of population and productivity growth on GDP are distinct, highlighting the complex interplay between these variables over time.
For a granular analysis of the varying factors' impact on GDP, Appendix 13 houses the extended data and interpretations.
The second phase of the analysis scrutinized development variables, which were altered incrementally from 0.1 to 0.9, with factor variables maintained at 0.005. Figures 19 and 20, alongside Table 4, illustrate how changes in development levels influence GDP.
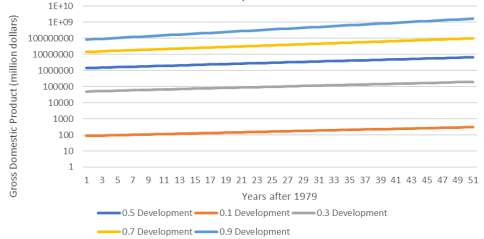
Figure 19. Modeled Gross Domestic Product of Economy Varying Development.
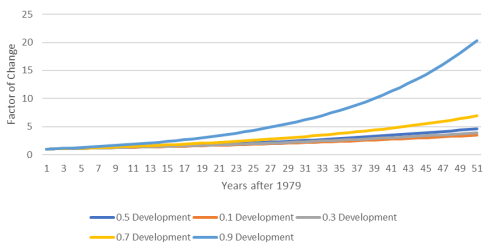
Figure 20. Modeled Gross Domestic Product of Economy.
Table of Varying Development.

Development Level

Absolute Population Growth

Factor of Productivity Growth

Year 0 GDP

Year 50 GDP

Factor of Change from Year 0 to Year 50

0.1

0.09352

1.018

86.429

302.16

3.496

0.3

42.578

1.020

49856.2

196545

3.942

0.5

731.718

1.024

1417925

6591795

4.649

0.7

4760.41

1.032

14274983

98472039

6.898

0.9

19273.9

1.054

82234784

1.67E+09

20.35

The analysis indicates a trend where economies with higher development indices grow disproportionately faster than their less developed counterparts. This acceleration exacerbates the divide, potentially entrenching poverty in lower development economies due to their inability to catch up.
Detailed results of the development variable analysis are available in Appendix 14, offering insights into potential policy targets to mitigate growing economic disparities.

5.2. Suggestions

Based on the insights gleaned from our model, several strategic recommendations can be formulated to foster GDP growth across economies:
1. Short-term Economic Growth: Economies looking for immediate uplift should incentivize factors that enhance population growth. These include Education, Unemployment, Survivability, Healthcare, Food, Land, and Cost of Living.
2. Long-term Economic Growth: For sustained economic development, the emphasis should be on productivity enhancements. Focused investment in Infrastructure, Healthcare, Telecommunications, and Innovations is likely to yield the most significant benefits.
3. Support for Less Developed Economies: Given the widening economic gap highlighted by our model, it is imperative for more developed economies to support their less developed counterparts. Without proactive measures such as increased investment in critical sectors like Infrastructure and Healthcare, there is a risk of entrenched disparities, exacerbating the poverty gap and compromising living standards globally.

5.3. Model Evaluation

The model's overall assessment reveals both strengths and limitations:
Regarding strengths, we have identified the following:
1. Versatility: The model adeptly predicts population, productivity, and GDP across diverse economies.
2. Predictive Accuracy: It correlates strongly with actual GDP figures, indicating reliable predictions.
3. Applicability: Its generic structure allows for broad application by substituting relevant data from any economy.
4. Simplified Inputs: Variables are straightforward and readily integrated into the model.
5. Data Inclusivity: A robust dataset ensures the model's generalizability without bias.
Similarly, we have identified the following limitations of the model:
1. Data Dependency: The model's precision is contingent on the quality and alignment of data from various sources.
2. Estimation Errors: Using estimated or proxy data could introduce inaccuracies.
3. Growth Discrepancies: Economic growth variance might lead to underestimation or overestimation in the model's output.
4. Economic Interdependence: Since GDP influences other economic factors, it can't be utilized as an input, which may limit certain analyses.
5. Complexity: The intricate nature of GDP prediction, due to the multitude of factors, complicates the model.
6. Exchange Rate Variations: Disparities in purchasing power parity among economies can complicate direct comparisons.
Therefore, to improve for heightened precision, employing the model over shorter time spans is advisable. Annual updates to the inputs for population and productivity can reduce deviations and adapt the model to reflect more current trends.
6. Conclusions
In conclusion, this paper introduces a mathematical model that significantly advances GDP prediction globally. By analyzing 39 years of data from 16 countries, we developed a model that integrates multi-dimensional variables to provide precise and actionable GDP forecasts.
Our research reveals that while population increases linearly, productivity grows exponentially. We distilled 24 key variables into robust sub-models for immediate and long-term metrics, resulting in a predictive equation that matches historical data closely. Sensitivity analysis highlighted productivity's greater impact on GDP growth, emphasizing the need for strategic investments in Infrastructure, Healthcare, Telecommunications, and Innovation.
The model notably points to widening economic disparities, urging developed countries to support less developed ones. Despite challenges like data dependency and growth discrepancies, the model offers a practical tool for policymakers, suggesting shorter data analysis intervals to better reflect rapid economic changes. Overall, this research fills a crucial gap in economic modeling literature, providing a framework for economic policies and strategies that promote inclusive and sustainable growth.
Abbreviations
GDP: Gross Domestic Product
HDI: Human Development Index
IMF: International Monetary Fund
GDPPC: Gross Domestic Product Per Capita
Author Contributions
Billy Gao is the sole author. The author read and approved the final manuscript.
Funding
This work is not supported by any external funding.
Data Availability Statement
The data is available from the corresponding author upon reasonable request.
Conflicts of Interest
The authors declare no conflicts of interest.
Appendix
The additional data utilized throughout the modeling process from Appendix 1 to Appendix 14 could be found in the following Git Hub link.
https://github.com/BdNWoG/Modeling-General-Gross-Domestic-Product-Across-All-Economies
References
[1] Fernando, J. What is Gross Domestic Product (GDP)? Investopedia. 2022, July 29. Retrieved from
[2] Finance & Development. Measuring GDP: GDP is important because it gives information about the size of the economy and how an economy is performing. International Monetary Fund (IMF). n.d. Retrieved from
[3] Wikimedia Foundation. Gross domestic product. Wikipedia. 2022, September 2. Retrieved from
[4] ResearchGate. The power of a single number: A political history of GDP. n.d. Retrieved from
[5] Zhang, H. Modeling and forecasting regional GDP in Sweden using autoregressive models. n.d. Retrieved from
[6] Zakai, M. A time series modeling on GDP of Pakistan. 1970, January 1. Retrieved from
[7] Li, Q., Yan, G., & Yu, C. A novel multi-factor three-step feature selection and Deep Learning Framework for regional GDP prediction: Evidence from China. Sustainability. 2022, 14(8), 4408.
[8] ResearchGate. Estimation of gross domestic product at sub-national scales using nighttime satellite imagery. n.d. Retrieved from
[9] Bhargava, A., Jamison, D. T., Lau, L. J., & Murray, C. J. L. Modeling the effects of health on economic growth. Journal of Health Economics. 2001, 20(3), 423–440.
[10] ANDREI, E.-A., & BUGUDUI, E. Econometric modeling of GDP time series. n.d. Retrieved from
[11] Bhuiyan, M. N. A., Ahmed, K. S., & Jahan, R. Study on Modeling and Forecasting of the GDP of Manufacturing Industries in Bangladesh. n.d. Retrieved from
[12] Sammy Wabomba, M. Modeling and forecasting Kenyan GDP using autoregressive integrated moving average (ARIMA) models. Science Journal of Applied Mathematics and Statistics. 2016, 4(2), 64.
[13] Li, G.-dong, Yamaguchi, D., Lin, H.-shan, & Nagai, M. The simulation modeling about the developments of GDP, population and primary energy consumption in China based on MATLAB. 2006 IEEE Conference on Cybernetics and Intelligent Systems.
[14] Fang, W. S., & Miller, S. M. Modeling the volatility of real GDP growth: The case of japan revisited. Japan and the World Economy. 2009, 21(3), 312–324.
[15] Okunade, A. A., You, X., & Koleyni, K. Cross-country Medical Expenditure Modeling using OECD panel data and ARDL approach: Investigating GDP, technology, and aging effects. Health Econometrics. 2018, 327–358.
[16] Feige, E. L., & Urban, I. Measuring underground (unobserved, non-observed, unrecorded) economies in transition countries: Can we trust GDP? SSRN Electronic Journal. 2008.
[17] University of Groningen. Maddison Project Database 2020. 2022, May 23. Retrieved from
[18] World Population Review. Developed countries list 2022. n.d. Retrieved from
[19] Brent Cornell. BioNinja. n.d. Retrieved from
[20] JSTOR. Birth, death and migration processes. n.d. Retrieved from
[21] United Nations. United Nations Population Division | Department of Economic and Social Affairs. n.d. Retrieved from
[22] Wagle, K. Population growth and components of population growth. Public Health Notes. 2022, August 17. Retrieved from
[23] Unacademy. Determinants of Population Change. 2022, February 27. Retrieved from
[24] Your Article Library. Top 4 determinants of population growth. 2016, February 3. Retrieved from
[25] Pettinger, T. Factors that affect population size and growth. Economics Help. 2021, November 26. Retrieved from
[26] Wiley Online Library. Developing a digital toolkit to enhance the... 2022. Retrieved from
[27] theOECD. Prices - Price level indices. n.d. Retrieved from
[28] The World Bank. Consumer Price Index (2010 = 100). n.d. Retrieved from
[29] The World Bank. Land area (sq. km). n.d. Retrieved from
[30] The World Bank. Land under cereal production (hectares). n.d. Retrieved from
[31] The World Bank. Cereal yield (kg per hectare). n.d. Retrieved from
[32] The World Bank. Mortality rate, infant (per 1,000 live births). n.d. Retrieved from
[33] The World Bank. Life expectancy at birth, total (years). n.d. Retrieved from
[34] TCdata360. Unemployment rate (% of total labor force) (WEO). n.d. Retrieved from
[35] The World Bank. Unemployment, total (% of total labor force) (modeled ILO estimate). n.d. Retrieved from
[36] HumanProgress. Education index. 2022, July 26. Retrieved from
[37] Wikimedia Foundation. Education index. Wikipedia. 2022, August 4. Retrieved from
[38] OECD. Public finance. n.d. Retrieved from
[39] ResearchGate. What economic and social factors affect GDP per capita a study on 40... n.d. Retrieved from
[40] ResearchGate. (PDF) Determinants of growth GDP per capita through panel data analysis... n.d. Retrieved from
[41] SpringerLink. Marshall, R. M. Factors influencing changes in productivity. 1982, January 1. Retrieved from
[42] Cengage. Productivity and growth the elements of productivity and... n.d. Retrieved from
[43] Science & Technology Development Journal - Economics - Law and Management. 2020, April 4. Retrieved from
[44] Prezi.com. Factors affecting GDP per capita of a country. n.d. Retrieved from
[45] OECD. The contribution of economic geography to GDP per capita. n.d. Retrieved from
[46] University of Cyprus. Factors affecting the productivity of European economies. n.d. Retrieved from
[47] Areppim. Casais, E. Tracking Government Workers' and politicians' probity. Corruption Index, From 1995 Onwards. n.d. Retrieved from
[48] The World Bank. Air Transport, passengers carried. n.d. Retrieved from
[49] The World Bank. Patent applications, residents. n.d. Retrieved from
[50] The World Bank. World Bank Open Data. n.d. Retrieved from
[51] The World Bank. Mobile cellular subscriptions (per 100 people). n.d. Retrieved from
[52] The World Bank. Merchandise imports (current US$). n.d. Retrieved from
Cite This Article
  • APA Style

    Gao, B. (2024). A Universal Model for General Gross Domestic Product Across Global Economies. International Journal of Economics, Finance and Management Sciences, 12(3), 127-141. https://doi.org/10.11648/j.ijefm.20241203.11

    Copy | Download

    ACS Style

    Gao, B. A Universal Model for General Gross Domestic Product Across Global Economies. Int. J. Econ. Finance Manag. Sci. 2024, 12(3), 127-141. doi: 10.11648/j.ijefm.20241203.11

    Copy | Download

    AMA Style

    Gao B. A Universal Model for General Gross Domestic Product Across Global Economies. Int J Econ Finance Manag Sci. 2024;12(3):127-141. doi: 10.11648/j.ijefm.20241203.11

    Copy | Download

  • @article{10.11648/j.ijefm.20241203.11,
      author = {Billy Gao},
      title = {A Universal Model for General Gross Domestic Product Across Global Economies
    },
      journal = {International Journal of Economics, Finance and Management Sciences},
      volume = {12},
      number = {3},
      pages = {127-141},
      doi = {10.11648/j.ijefm.20241203.11},
      url = {https://doi.org/10.11648/j.ijefm.20241203.11},
      eprint = {https://article.sciencepublishinggroup.com/pdf/10.11648.j.ijefm.20241203.11},
      abstract = {In addressing the need for a robust economic measure, this paper presents a mathematical model to forecast Gross Domestic Product (GDP) across diverse global economies. Our model, constructed from a dataset spanning 39 years from 16 varied economies, deciphers GDP by dissecting its fundamental components of population and productivity. Through meticulous literature review and data analysis, the research develops four predictive models, using linear and exponential trends, to represent the immediate and projected rates of change in both population and productivity. The research reveals a nuanced dynamic between these elements, identifying productivity, especially in infrastructure, healthcare, telecommunications, and innovation, as a pivotal force in driving economic growth. The study not only underlines the significant influence of these sectors but also the critical role of developed economies in aiding less developed ones to counteract the widening poverty gap. A comprehensive sensitivity analysis within the paper evaluates the impact of these factors on GDP, equipping policymakers with essential insights into enhancing economic progress. By combining immediate and long-term growth metrics derived from twenty-four influential variables into a cohesive predictive model, this research illuminates the complex interplay of forces shaping GDP trajectories. It suggests that while boosting population can yield short-term economic gains, enduring prosperity hinges on amplifying productivity. Moreover, the study points to the potential socio-economic divides that necessitate proactive measures for equitable development. Although challenges such as data dependency and growth discrepancies are acknowledged, the model proposes more frequent data analyses for capturing economic fluctuations accurately. Conclusively, the paper bridges a critical gap in economic modeling literature and provides a pragmatic framework for crafting inclusive economic policies and development strategies, thus making a significant contribution to both theoretical and applied economic fields.
    },
     year = {2024}
    }
    

    Copy | Download

  • TY  - JOUR
    T1  - A Universal Model for General Gross Domestic Product Across Global Economies
    
    AU  - Billy Gao
    Y1  - 2024/05/17
    PY  - 2024
    N1  - https://doi.org/10.11648/j.ijefm.20241203.11
    DO  - 10.11648/j.ijefm.20241203.11
    T2  - International Journal of Economics, Finance and Management Sciences
    JF  - International Journal of Economics, Finance and Management Sciences
    JO  - International Journal of Economics, Finance and Management Sciences
    SP  - 127
    EP  - 141
    PB  - Science Publishing Group
    SN  - 2326-9561
    UR  - https://doi.org/10.11648/j.ijefm.20241203.11
    AB  - In addressing the need for a robust economic measure, this paper presents a mathematical model to forecast Gross Domestic Product (GDP) across diverse global economies. Our model, constructed from a dataset spanning 39 years from 16 varied economies, deciphers GDP by dissecting its fundamental components of population and productivity. Through meticulous literature review and data analysis, the research develops four predictive models, using linear and exponential trends, to represent the immediate and projected rates of change in both population and productivity. The research reveals a nuanced dynamic between these elements, identifying productivity, especially in infrastructure, healthcare, telecommunications, and innovation, as a pivotal force in driving economic growth. The study not only underlines the significant influence of these sectors but also the critical role of developed economies in aiding less developed ones to counteract the widening poverty gap. A comprehensive sensitivity analysis within the paper evaluates the impact of these factors on GDP, equipping policymakers with essential insights into enhancing economic progress. By combining immediate and long-term growth metrics derived from twenty-four influential variables into a cohesive predictive model, this research illuminates the complex interplay of forces shaping GDP trajectories. It suggests that while boosting population can yield short-term economic gains, enduring prosperity hinges on amplifying productivity. Moreover, the study points to the potential socio-economic divides that necessitate proactive measures for equitable development. Although challenges such as data dependency and growth discrepancies are acknowledged, the model proposes more frequent data analyses for capturing economic fluctuations accurately. Conclusively, the paper bridges a critical gap in economic modeling literature and provides a pragmatic framework for crafting inclusive economic policies and development strategies, thus making a significant contribution to both theoretical and applied economic fields.
    
    VL  - 12
    IS  - 3
    ER  - 

    Copy | Download

Author Information
  • School of Engineering, Stanford University, Stanford, United States

    Biography: Billy Gao is a student at Stanford University. He is on his way on acquiring his Bachelor of Science in Mechanical Engineering from Stanford University, and his Master of Science in Computer Science from the same institution. He has had many years of experience in the field of mathematical modeling having previously published work in the aviation modeling field on the International Conference on Informatics and Computational Sciences. He has also participated in research in other fields such as social sciences, computer algorithms, linguistics and robotics with works expected.

    Research Fields: Mathematical Modeling, Simulation, Predication, Economics, Computer Science, Social Behaviors